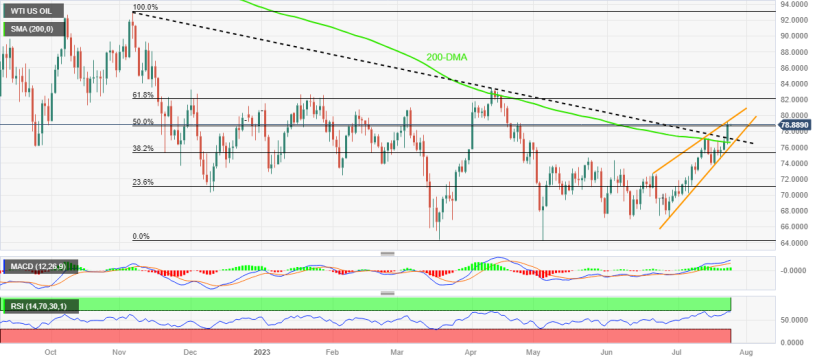
- WTI struggles to cheer China inspired risk-on mood amid overbought RSI.
- Five-week-old rising support line tests Oil buyers at multi-month high.
- Sustained break of 200-DMA, previous key resistance line keeps energy bulls hopeful.
- Rising wedge bearish chart formation teases WTI sellers but $76.40 appears the key to confirm downside.
WTI crude oil remains sidelined at the highest levels since late February, marked the previous day, as it fails to justify China-driven upbeat sentiment during early Tuesday. In doing so, the black gold seesaws around $78.90 by the press time amid overbought RSI (14) line.
Also read: S&P500 Futures struggle to justify optimism in China, Hong Kong amid sluggish yields, pre-Fed anxiety
Apart from the RSI conditions, the top line of a five-week-old rising wedge bearish chart pattern, around $79.50 by the press time, also challenges the Oil buyers.
However, a clear upside break of the 200-DMA and the previously important resistance line stretched from November 2022, respectively near $76.60 and $76.90, keeps the WTI bulls hopeful.
With this, the black gold is likely to edge higher and hence can cross the $79.50 hurdle, which in turn highlights the $80.00 psychological magnet for energy bulls to watch afterward.
In a case where the WTI remains firer past the $80.00 threshold despite overbought RSI, the 61.8% Fibonacci retracement of its November 2022 to May 2023 downside, near $82.15, and April’s peak of $83.40 will be crucial to watch.
Meanwhile, a downside break of the previous support line and the 200-DMA isn’t likely to convince the Oil sellers unless the commodity confirms the rising wedge bearish chart pattern with a daily closing below $76.40.
WTI crude oil: Daily chart
Trend: Pullback expected
