- The daily chart suggests a fading buying pressure and possible sellers' entry, even as the GBP/JPY maintains an upward bias.
- GBP/JPY bearish crossover of the Tenkan-Sen and the Kijun-Sen and the Chikou-Span line crossing below price action point towards potential bearish activity.
- For GBP/JPY to turn bullish, the pair must reclaim the 182.00 level.
On Monday, the GBP/JPY faced barricades at around 182.30s and dropped below the 182.00 psychological level amid a risk-on impulse. Still, economic data from the United Kingdom (UK) weakened the Pound Sterling (GBP), which printed losses against most G8 FX currencies. As the Asian session begins, the GBP/JPY is trading at 181.41, posting minuscule gains of 0.02%.
GBP/JPY Price Analysis: Technical outlook
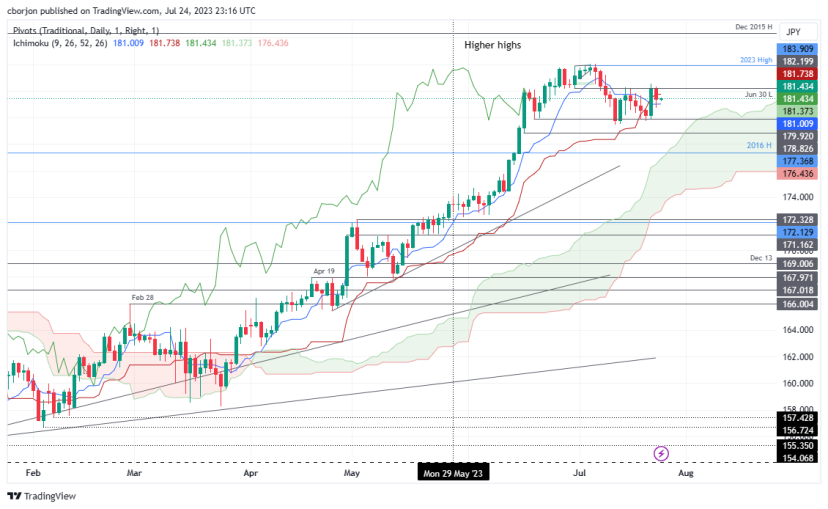
From a daily chart standpoint, the GBP/JPY is upward biased, though a bearish crossover of the Tenkan-Sen below the Kijun-Sen, suggests that buying pressure is fading, and sellers are stepping in. At the same time, the Chikou-Span line at 181.40, is crossing below the price action, another bearish signal. Yet the GBP/JPY is still trending up, as the Ichimoku Cloud (Kumo) remains below price action.
Nevertheless, the GBP/JPY might be subject to a pullback in the near term. In that scenario, the GBP/JPY first support would be the Tenkan-Sen at 181.00. A breach of the latter will expose the June 20 low of 179.92, followed by the July 20 daily low of 179.73, ahead of the June 12 low of 179.46, ahead of diving towards.
For a bullish resumption, the GBP/JPY must claim 182.00. Once done, the next resistance would emerge at the psychological 183.00 area before the year-to-date (YTD) high of 183.90.
GBP/JPY Price Action – Daily chart