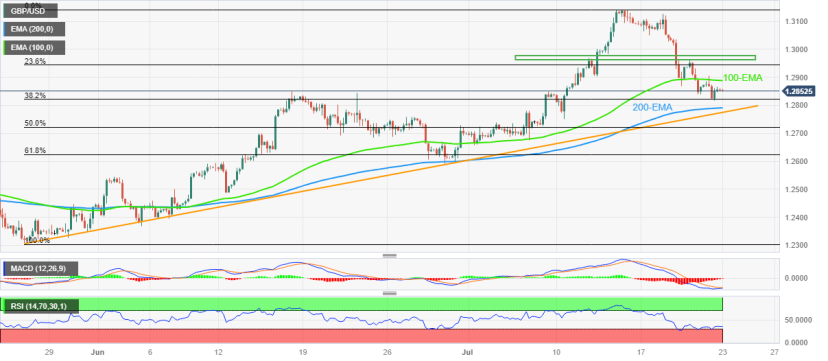
- GBP/USD remains indecisive after positing the biggest weekly loss in six months.
- Cable pair seesaws between 100-EMA and 200-EMA as oscillators fade bearish bias.
- Two-month-old ascending support line acts as additional downside filter.
- Pound Sterling’s recovery needs validation from 1.2980, UK/US PMI for July.
GBP/USD remains sidelined while licking its wounds around 1.2850 after the heavy weekly fall during early Monday morning in Asia. In doing so, the Cable pair seesaws between the 100 and 200 Exponential Moving Average (EMA) as the oscillators appear poking bears ahead of the key preliminary readings of the UK and US PMIs for July.
Also read: GBP/USD Weekly Forecast: Down but not out, awaiting the Fed
With this, GBP/USD remains sidelined unless trading between the aforementioned EMA envelope, currently between 1.2890 and 1.2790.
That said, the impending bull cross on the MACD and the nearly oversold RSI (14) line suggests a corrective bounce off the Pound Sterling, which in turn highlights the 100-EMA hurdle of 1.2890.
Following that, the horizontal area comprising multiple levels marked since July 12, near 1.2965-80, will be crucial to watch as a clear break of the same will propel the quote towards the multi-month high marked earlier in July around 1.3145.
However, the 1.3000 psychological magnet and July 17 swing low of around 1.3065 can act as an intermediate halt during the anticipated run-up.
Meanwhile, a downside break of the 200-EMA support of around 1.2790 isn’t a clear call for the GBP/USD sellers as an upward-sloping support line from late May, near 1.2770 at the latest, could challenge the bears.
In a case where the Cable pair remains bearish past 1.2770, the odds of witnessing a gradual decline towards the late June swing low surrounding 1.2590 can’t be ruled out.
GBP/USD: Four-hour chart
Trend: Limited downside expected