- Natural Gas holds lower ground near intraday bottom after reversing from two-week high.
- Bearish moving average crossover, downbeat oscillators favor XNG/USD sellers.
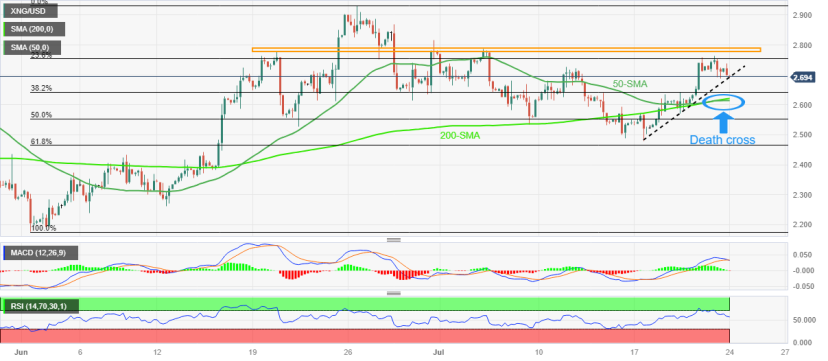
- Natural Gas recovery appears elusive below $2.80; $2.62 appears a tough nut to crack for sellers.
Natural Gas Price (XNG/USD) drops more than 1.0% during early Monday to $2.69, reversing from 13-day high marked the previous day, as energy buyers retreat at the start of the key week comprising top-tier data/event. In doing so, the energy instrument snaps four-day winning streak while posting the biggest daily loss, so far, since July 17.
That said, a one-week-old ascending trend line restricts immediate downside of the XNG/USD near $2.69.
However, the 50-SMA pierces the 200-SMA from above and portrays the “death cross” bearish moving average crossover to lure the XNG/USD sellers. Adding strength to the downside bias is the looming bear cross on the MACD and a descending RSI (14) line, not oversold.
With this, the Natural Gas Price is likely to break the immediate support line and can drops towards the stated SMA confluence surrounding $2.62.
In a case where the XNG/USD remains bearish past $2.62, the odds of witnessing a downturn towards the monthly low of around $2.47 can’t be ruled out.
On the flip side, a five-week-old horizontal resistance area surrounding $2.79-80 restricts immediate recovery of the Natural Gas Price.
Following that, tops marked in June and March, respectively near $2.98 and $3.07, will be in the spotlight.
Natural Gas Price: Four-hour chart
Trend: Further downside expected