- GBP/USD bulls are in control with eyes on the 1.22 areas.
- The price is stalling on the bid on the short-term, however.
GBP/USD is offering mixed signals across the time frames, from bullish on the weekly to meanwhile bearish lower down on the 4-hour, but ultimately the bulls are in control. The following illustrates the prospects of a correction in the coming hours from which bulls might appear in droves for a continuation into the 1.22 areas.
GBP/USD weekly chart
The weekly chart's M-formation's neckline is a compelling target area for the bulls to aim for where it aligns with key Fibonaccis.
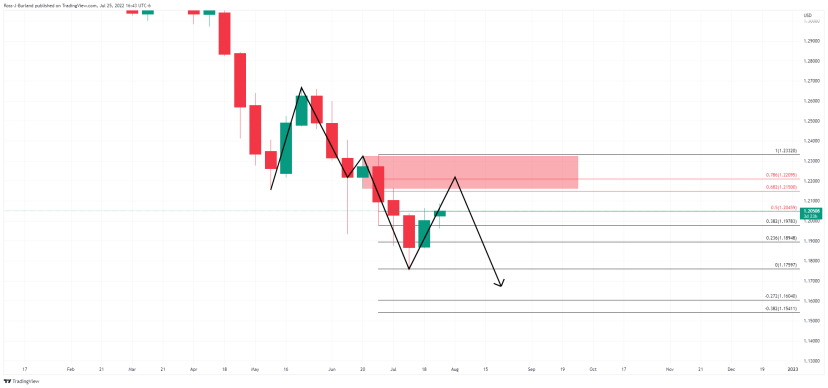
GBP/USD daily chart
Within the resistance area, there is a price imbalance on the daily chart which could lure the price in following the recent rally from the neckline of the W-formation.
GBP/USD H4 chart
The 4-hour chart has a price imbalance just below the recent lows as per the greyed-out area. A move into mitigating this where the 61.8% Fibo lies could be the next move on the cards before bulls fully engage.